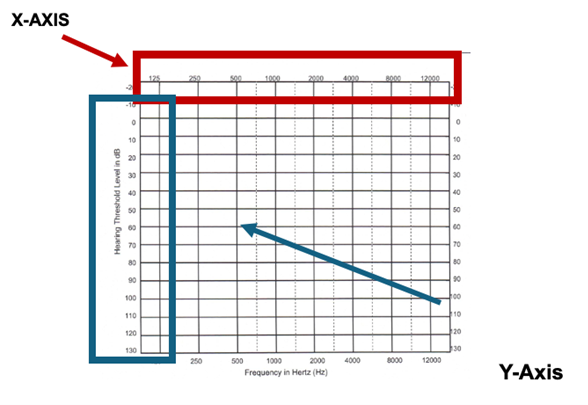
Axes of the Audiogram:
- X-axis (Horizontal): Frequencies (Pitch), measured in Hertz (Hz).
- Low pitch sounds (e.g., bass drum) are on the left.
- High pitch sounds (e.g., bird chirp) are on the right.
- Y-axis (Vertical): Hearing levels in Decibels (dB), measure loudness.
- Top (0-20 dB) = Normal hearing
- Bottom (71+ dB) = Severe: profound hearing loss
Sample Audiogram (X and Y Axis)
Symbols and Terms on the Audiogram
- O (Red): Right ear results.
- X (Blue): Left ear results.
- Brackets or triangles may indicate results when hearing aids are used.
- Masking: involves introducing noise into the non-test ear during hearing assessments to prevent it from detecting sounds meant for the test ear. This technique ensures that each ear's hearing ability is measured independently, leading to more accurate identification of hearing thresholds and types of hearing loss.
| Key | Right (Red) | Left (Blue) |
| A/C | O | X |
| A/C no response |
 |
X |
| A/C masking | ||
| A/C masking no response |
 |
 |
| BC | < | > |
| BC no response |
[ | ] |
| BC masking no response |
 |
 |